

16-Year Nebraska Study Finds More Phosphorus Does Not Always Increase Corn Profits



A 16-year University of Nebraska–Lincoln study suggests that applying more phosphorus fertilizer does not necessarily produce higher corn yields or better returns, a finding that has become increasingly relevant as U.S. phosphate fertilizer prices remain near or above $900 per ton.
The long-term field experiment compared several phosphorus management strategies in continuous dryland corn in eastern Nebraska. Researchers found that maintaining very high soil-test phosphorus required substantially more fertilizer than crop-removal or lower soil-test strategies, but the additional phosphorus did not consistently increase grain yield.
The findings do not mean farmers should eliminate phosphorus applications. The same experiment showed that allowing soil phosphorus to fall too low increased yield risk. Instead, Nebraska specialists recommend directing fertilizer toward fields and management zones where soil tests indicate that a crop response is most likely.
Phosphorus fertilizer remains expensive for U.S. farmers

The new Nebraska Extension analysis comes as phosphate fertilizer remains a significant production cost for U.S. corn growers.
Average U.S. retail prices during September 21–25, 2026 were approximately $926 per ton for diammonium phosphate, or DAP, and $970 per ton for monoammonium phosphate, or MAP, according to national retail data cited by Nebraska Extension.
| Fertilizer | September 2026 retail price | Change from year earlier |
|---|---|---|
| DAP | $926/t | +2.4% |
| MAP | $970/t | +5.2% |
| 10-34-0 starter | $701/t | +5.3% |
On a nutrient basis, Nebraska Extension calculated that those prices represented approximately $0.93 per pound of P₂O₅ for MAP, $1.01 for DAP and $1.03 for liquid 10-34-0 before accounting for the value of nitrogen supplied by the products.
That makes the economics of where phosphorus is applied increasingly important.
Researchers followed the same corn system for 16 years
The underlying experiment was conducted at the University of Nebraska–Lincoln Haskell Agricultural Laboratory near Concord, Nebraska, from 2000 through 2015.
The site was continuous dryland corn on Nora silt loam soil with an initial Bray-1 soil phosphorus concentration of approximately 16 ppm.
Researchers compared several phosphorus strategies:
- no phosphorus fertilizer;
- phosphorus applied according to previous crop removal;
- maintaining soil-test phosphorus near 15 ppm Bray-1 P;
- maintaining soil-test phosphorus near 30 ppm;
- maintaining soil-test phosphorus near 45 ppm.
The research was later published in Agronomy Journal by Swetabh Patel, Charles Shapiro and Javed Iqbal.
High soil phosphorus required much more fertilizer
The differences in total fertilizer use became substantial over the 16-year experiment.
| Strategy | Total P₂O₅ applied over 16 years | Average annual application |
|---|---|---|
| 15 ppm soil-test P | 536 lb/ac | About 34 lb/ac/year |
| Crop removal | 664 lb/ac | About 42 lb/ac/year |
| 30 ppm soil-test P | 893 lb/ac | About 56 lb/ac/year |
| 45 ppm soil-test P | 1,304 lb/ac | About 82 lb/ac/year |
The 45-ppm strategy therefore required almost twice as much phosphorus fertilizer as the crop-removal approach.
The peer-reviewed study similarly concluded that maintaining soil phosphorus at 30 or 45 ppm required substantially more phosphorus than the crop-removal and 15-ppm strategies.
But higher phosphorus did not consistently increase corn yield
The additional fertilizer did not produce an equivalent yield advantage.
Average corn yields across the 16 years were approximately:
| Phosphorus strategy | Average corn yield |
|---|---|
| No phosphorus | 112 bu/ac |
| 15 ppm | 119 bu/ac |
| 30 ppm | 121 bu/ac |
| Crop removal | 123 bu/ac |
| 45 ppm | 126 bu/ac |
Although the numerical yield was highest in the 45-ppm treatment, researchers found no statistically significant yield difference among the phosphorus-fertilized strategies when results were averaged across all 16 years.
In other words, maintaining much higher soil-test phosphorus required considerably more fertilizer without consistently delivering additional yield.
Researchers call this a question of profitability, not simply yield
The Nebraska Extension specialists summarized the practical implication clearly:
“More soil-test P is not automatically more profitable.”
That distinction is particularly important when fertilizer prices are high.
A management strategy can produce slightly higher average yield and still generate a weaker fertilizer return if the extra yield is not large enough to cover the additional phosphorus cost.
Crop-removal strategy delivered the highest fertilizer ROI
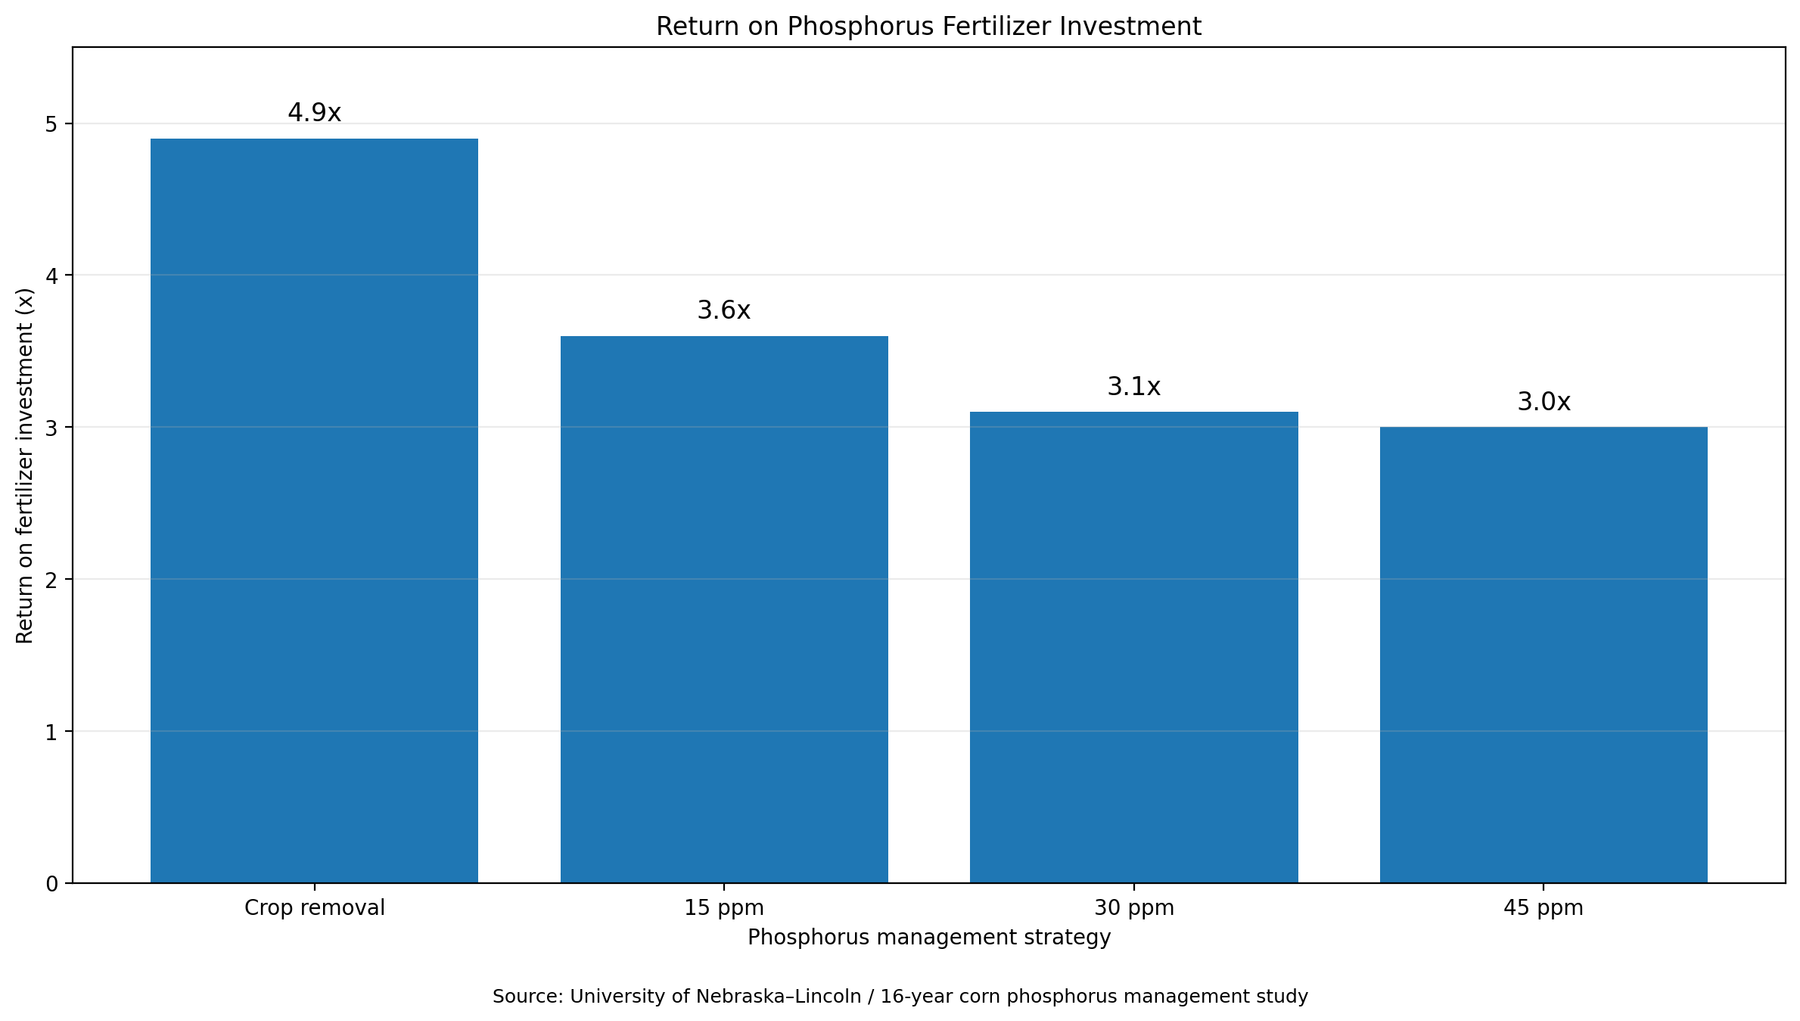
The long-term economic analysis found that the crop-removal strategy produced the highest return on phosphorus fertilizer investment.
| Strategy | Return on phosphorus investment |
|---|---|
| Crop removal | 4.9x |
| 15 ppm | About 3.6x |
| 30 ppm | About 3.1x |
| 45 ppm | About 3.0x |
The researchers calculated return on investment by comparing the value of the yield increase over the no-phosphorus treatment with the cost of phosphorus applied in each year.
The 45-ppm strategy generated strong returns under some individual conditions, but over the entire study its much higher fertilizer requirement reduced its overall fertilizer efficiency.
Crop removal used roughly half as much phosphorus as the 45-ppm strategy
The contrast is especially clear when fertilizer use and yield are considered together.
The crop-removal treatment received approximately 664 lb P₂O₅ per acre during the 16-year experiment and averaged about 123 bushels of corn per acre.
The 45-ppm treatment received approximately 1,304 lb P₂O₅ per acre and averaged about 126 bushels per acre.
That means the high-phosphorus treatment received nearly 640 additional pounds of P₂O₅ over the experiment for an average numerical yield difference of only about three bushels per acre.
Because yields among phosphorus-fertilized treatments were not statistically different across the entire 16-year period, those figures should not be interpreted as proof that the extra fertilizer caused a three-bushel yield increase.
Too little phosphorus also created problems
The research does not support eliminating phosphorus fertilizer across an entire farm.
Where no phosphorus was applied, soil-test P declined substantially over time.
Bray-1 phosphorus fell from approximately 16 ppm near the beginning of the experiment to around 8 ppm by the end.
The no-phosphorus treatment produced approximately 9% lower corn yields during normal years and around 12% lower yields during wet years compared with phosphorus-fertilized treatments.
The researchers therefore found risks at both extremes: continuously removing phosphorus without replacing it depleted the soil, while maintaining unnecessarily high soil-test P consumed much more fertilizer without consistently increasing yield.
The economic optimum is between the two extremes
For farmers facing high fertilizer prices, the practical question is therefore not simply whether to apply phosphorus.
It is where phosphorus is likely to produce an economic crop response.
Nebraska Extension recommends prioritizing low-testing fields, maintaining adequate phosphorus where deficiency could reduce yield and considering reduced or postponed applications where soil-test P is already well above the response range.
The specialists summarized the strategy as targeting phosphorus “where it is most likely to pay.”
Soil testing becomes more valuable when fertilizer is expensive
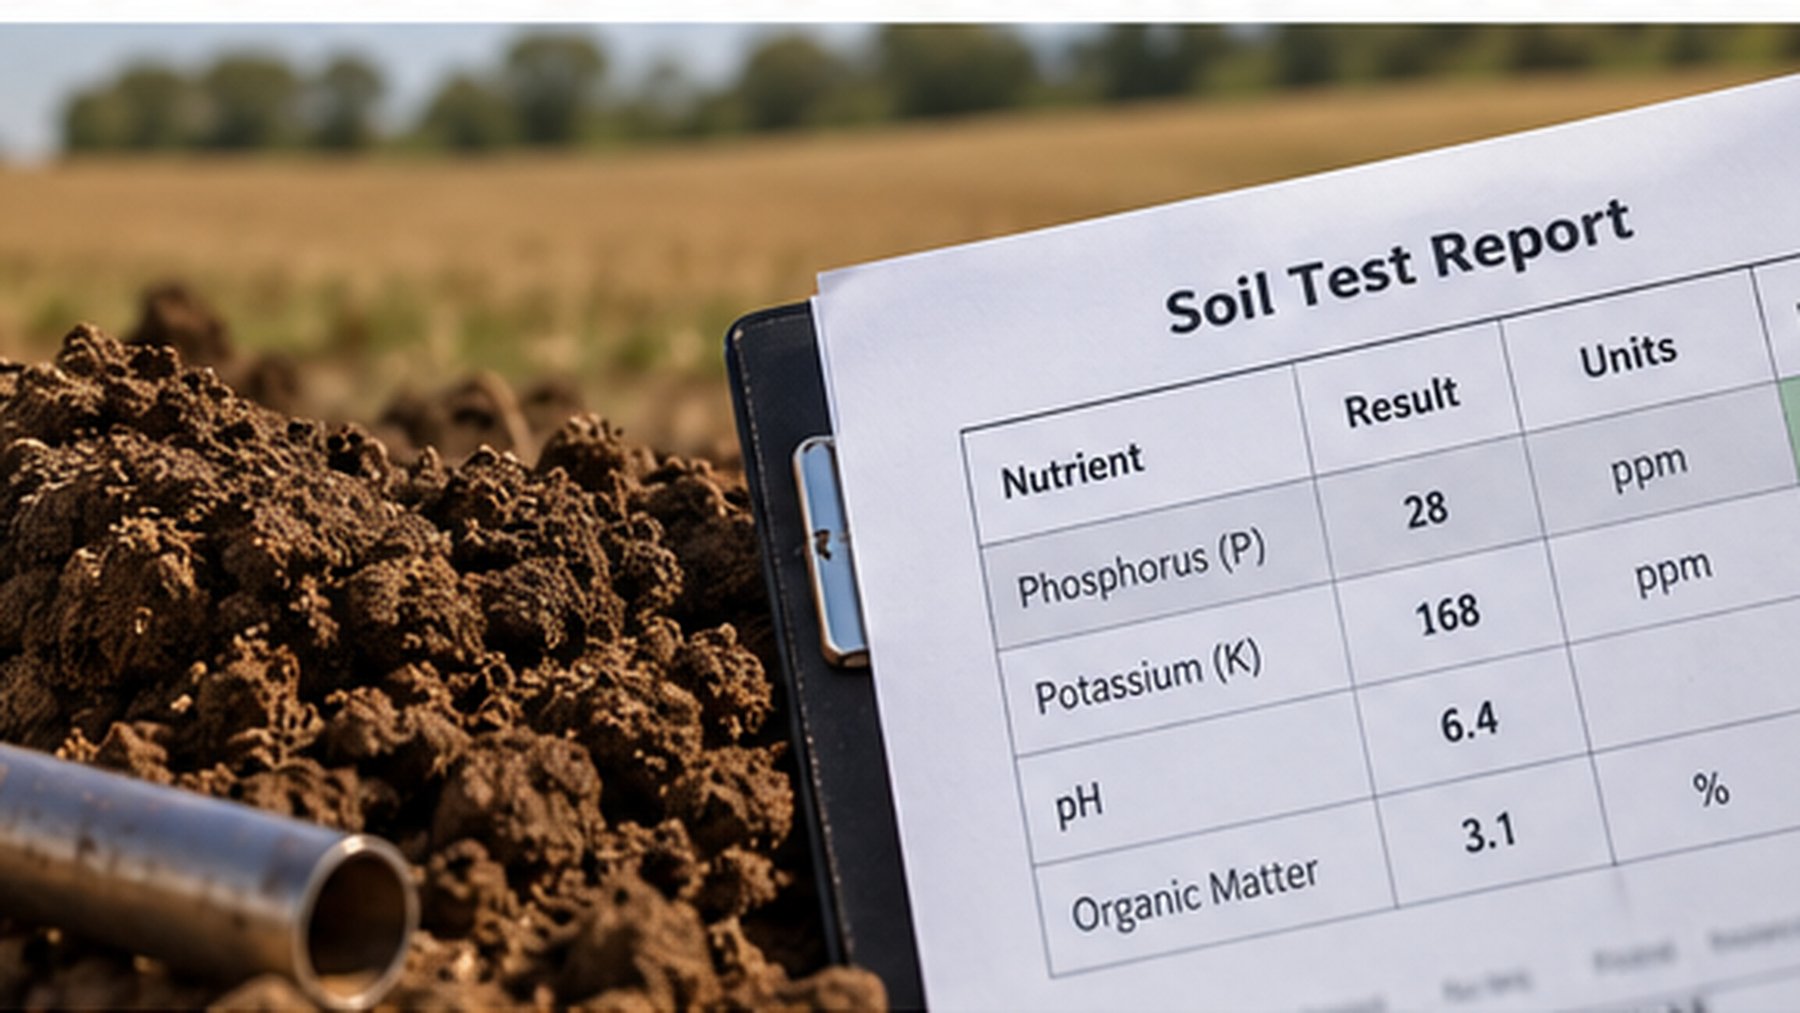
Nebraska Extension generally recommends soil sampling from the surface 0–8 inches every three to five years for phosphorus, potassium and micronutrient management.
For corn following corn, the university uses a critical Bray-1 P level of approximately 20 ppm.
For corn following soybean, the critical level is approximately 15 ppm.
According to current Nebraska recommendations, additional phosphorus is generally not recommended when Bray-1 P exceeds approximately 25 ppm for corn following corn or 20 ppm for corn following soybean.
That means a farmer with high-testing soil may have the option to defer fertilizer during an expensive year without creating an immediate yield penalty.
Not every phosphorus soil test is interchangeable
Different laboratory procedures are used to estimate plant-available soil phosphorus.
Nebraska Extension recommendations are primarily calibrated to Bray-1 P, but producers may also receive Mehlich II, Mehlich III or Olsen P results.
Soil chemistry matters when selecting a test.
In calcareous and high-pH soils common in central and western Nebraska, the Bray-1 method can underestimate plant-available phosphorus. Nebraska Extension recommends the Olsen method for those conditions.
High-testing fields may provide an opportunity to defer purchases
For fields already well above the critical soil-test phosphorus level, postponing an application can effectively use phosphorus accumulated from previous fertilizer or manure applications.
This can be particularly attractive when DAP and MAP prices are high.
However, a fertilizer holiday is not permanent nutrient replacement. Grain harvest continues to remove phosphorus from the field, gradually reducing soil-test levels.
Farmers therefore need repeat soil tests to determine when phosphorus applications should resume.
Crop-removal phosphorus is a maintenance strategy
A crop-removal program estimates the amount of phosphorus exported from the field in harvested grain and replaces approximately that quantity.
The strategy differs from deliberately building soil-test phosphorus to a much higher target.
In the Nebraska experiment, crop removal performed particularly well economically because it maintained phosphorus supply without requiring the large fertilizer quantities needed to sustain the 30- and 45-ppm treatments.
Wet years produced an interesting result
Weather also influenced the response to phosphorus management.
During wet years, the crop-removal strategy produced approximately 8% greater yield than the treatment maintaining Bray-1 soil phosphorus near 15 ppm.
That result illustrates why the minimum acceptable soil-test level is not necessarily the economically optimal strategy under every environmental condition.
The authors concluded that phosphorus recommendations need to account for both soil fertility and environmental variability.
Higher phosphorus increased grain P concentration without consistently increasing yield
The 30- and 45-ppm treatments increased phosphorus concentration in corn grain by approximately 6%–12% compared with the 15-ppm and crop-removal treatments.
But that additional phosphorus uptake did not consistently translate into more grain.
The Nebraska Extension article describes this phenomenon as “luxury P consumption.”
In practical terms, corn was able to take up additional phosphorus without converting all of that additional nutrient uptake into additional yield.
Manure can change the phosphorus calculation
Commercial DAP or MAP is not the only source of phosphorus available to a field.
Manure can contain substantial amounts of phosphorus, and repeated manure applications can push soil-test phosphorus well above the level needed for crop response.
Farmers should therefore account for manure-derived phosphorus before buying additional commercial fertilizer.
Applying commercial phosphorus to a high-testing field with a substantial manure history can effectively mean paying for nutrient supply that is already present.
Excessive soil phosphorus can also increase environmental risk
There is another reason not to build soil-test phosphorus indefinitely.
Research across the U.S. Midwest has repeatedly found that phosphorus-loss risk generally increases as soil phosphorus concentrations rise.
Phosphorus transported in runoff can contribute to eutrophication and harmful algal blooms in lakes, reservoirs and other surface waters.
Efficient phosphorus management therefore has both an economic and environmental benefit.
Variable-rate application could make phosphorus spending more targeted
Field-average soil tests can hide substantial within-field variability.
Some parts of a field may test well above the critical phosphorus range while other zones remain deficient.
Nebraska specialists recommend combining grid or management-zone soil testing with yield information where appropriate.
Variable-rate technology can then reduce fertilizer rates in high-testing zones while directing more phosphorus toward areas where a response is more likely.
Banding can also improve short-term phosphorus efficiency
Placement is another management option when fertilizer prices are high.
Banding phosphorus concentrates fertilizer near the crop root zone rather than distributing the same amount uniformly throughout the soil surface.
Under some conditions, this can improve short-term nutrient accessibility and allow producers to manage fertilizer more efficiently.
The economic response still depends on soil test, crop rotation, placement equipment and local conditions.
The Nebraska results should not be applied blindly across the Corn Belt
The researchers also caution against treating a single long-term experiment as a universal fertilizer prescription.
The study involved continuous dryland corn grown on a specific Nebraska soil.
Responses could differ in:
- irrigated corn;
- higher-yield environments;
- corn-soybean rotations;
- different soil types;
- different climates;
- fields with different starting soil phosphorus levels.
The broader lesson is therefore about matching phosphorus input to soil fertility and crop removal rather than adopting one fixed fertilizer rate everywhere.
Recent Midwest research points in the same direction
A broader Agronomy Journal analysis of phosphorus management across the Upper U.S. Midwest also found limited benefit from maintaining phosphorus substantially above agronomic sufficiency levels.
The authors cited the Nebraska 16-year trial as evidence that building Bray-1 soil phosphorus to 30 or 45 ppm did not improve corn yield compared with crop-removal management or maintaining approximately 15 ppm under those study conditions.
This supports a wider shift toward more site-specific phosphorus recommendations rather than routine buildup regardless of existing soil fertility.
What the study means at today’s DAP and MAP prices
The original 16-year experiment included years with very different fertilizer and corn prices.
But the economic principle becomes more important as phosphate fertilizer gets more expensive.
When MAP approaches $1,000 per ton, every unnecessary pound of P₂O₅ has a larger effect on production cost.
At the same time, cutting phosphorus on deficient ground can reduce yield and cost more than the fertilizer saved.
The objective is therefore to eliminate low-return phosphorus, not simply reduce phosphorus everywhere.
Five practical implications for corn growers
- Use recent soil tests. High fertilizer prices increase the value of knowing where phosphorus is actually deficient.
- Prioritize low-testing acres. These fields have the greatest probability of responding to fertilizer.
- Consider deferring P on high-testing soils. Existing soil phosphorus may be sufficient for the next crop.
- Credit manure and other phosphorus sources. Do not purchase the same nutrient twice.
- Evaluate crop-removal and variable-rate strategies. Both can help align fertilizer spending with actual nutrient demand.
What farmers should not conclude from the study
The research does not demonstrate that phosphorus fertilizer is unnecessary.
It also does not establish that crop-removal fertilization will always be the most profitable option for every field.
Instead, the 16-year dataset shows that maintaining very high soil phosphorus can require substantially larger fertilizer inputs without delivering a consistent yield advantage, while allowing soil phosphorus to become deficient creates its own yield risk.
Frequently asked questions
Not necessarily. In the 16-year Nebraska trial, phosphorus-fertilized treatments produced higher yields than the no-phosphorus treatment, but maintaining very high soil-test P did not consistently increase yield compared with more moderate strategies.
Applying phosphorus according to previous crop removal produced the highest long-term fertilizer ROI at approximately 4.9x.
Nebraska Extension cited national retail averages of approximately $926/t for DAP and $970/t for MAP during September 21–25.
In some high-testing fields, Nebraska Extension says an application may be reduced or postponed because a yield response is unlikely. Decisions should be based on current soil tests and local recommendations.
In the Nebraska experiment, soil phosphorus declined substantially and the no-phosphorus treatment experienced lower yields, showing that complete long-term phosphorus elimination can create deficiency and yield risk.
Crop-removal management estimates the phosphorus removed in harvested grain and replaces approximately that amount rather than deliberately building soil phosphorus to a much higher target.
Plants may absorb additional phosphorus without producing a proportional yield increase. High soil-test phosphorus can also increase fertilizer cost and environmental phosphorus-loss risk.

Enjoyed this story?
Every Monday, our subscribers get their hands on a digest of the most trending agriculture news. You can join them too!








Discussion0 comments