

Top 5 Fertilizer Importers in 2026: Brazil, U.S., India, China and Australia

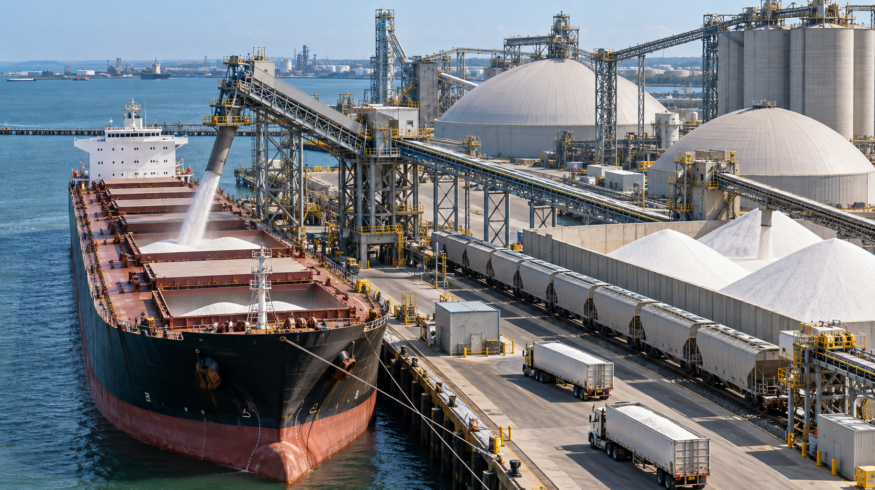

Brazil remained the largest major fertilizer-import market by physical volume in the first half of 2026, followed by the United States, India, China and Australia, according to customs-based trade data compiled across the five largest country-level import markets from 2025.
Together, the five countries imported approximately 57.7 million metric tons of fertilizers in January-June 2026. The ranking also shows a sharp divergence in demand: Brazil and the United States imported slightly less than a year earlier, while India, China and Australia increased purchases.
The shift matters because 2026 has been shaped by unusually high fertilizer prices, the disruption of Persian Gulf trade routes, tighter nitrogen availability and changes in phosphate and potash flows. These conditions have forced the world’s largest agricultural buyers to adjust procurement strategies, supplier mixes and timing.
Top 5 fertilizer importing countries in H1 2026
| Rank | Country | H1 2026 fertilizer imports | H1 2025 | Year-on-year change |
|---|---|---|---|---|
| 1 | Brazil | 18.31 million t | 19.42 million t | -5.7% |
| 2 | United States | 14.44 million t | 14.84 million t | -2.7% |
| 3 | India | 9.94 million t | 7.54 million t | +31.9% |
| 4 | China | 9.61 million t | 6.94 million t | +38.6% |
| 5 | Australia | 5.39 million t | 4.89 million t | +10.1% |
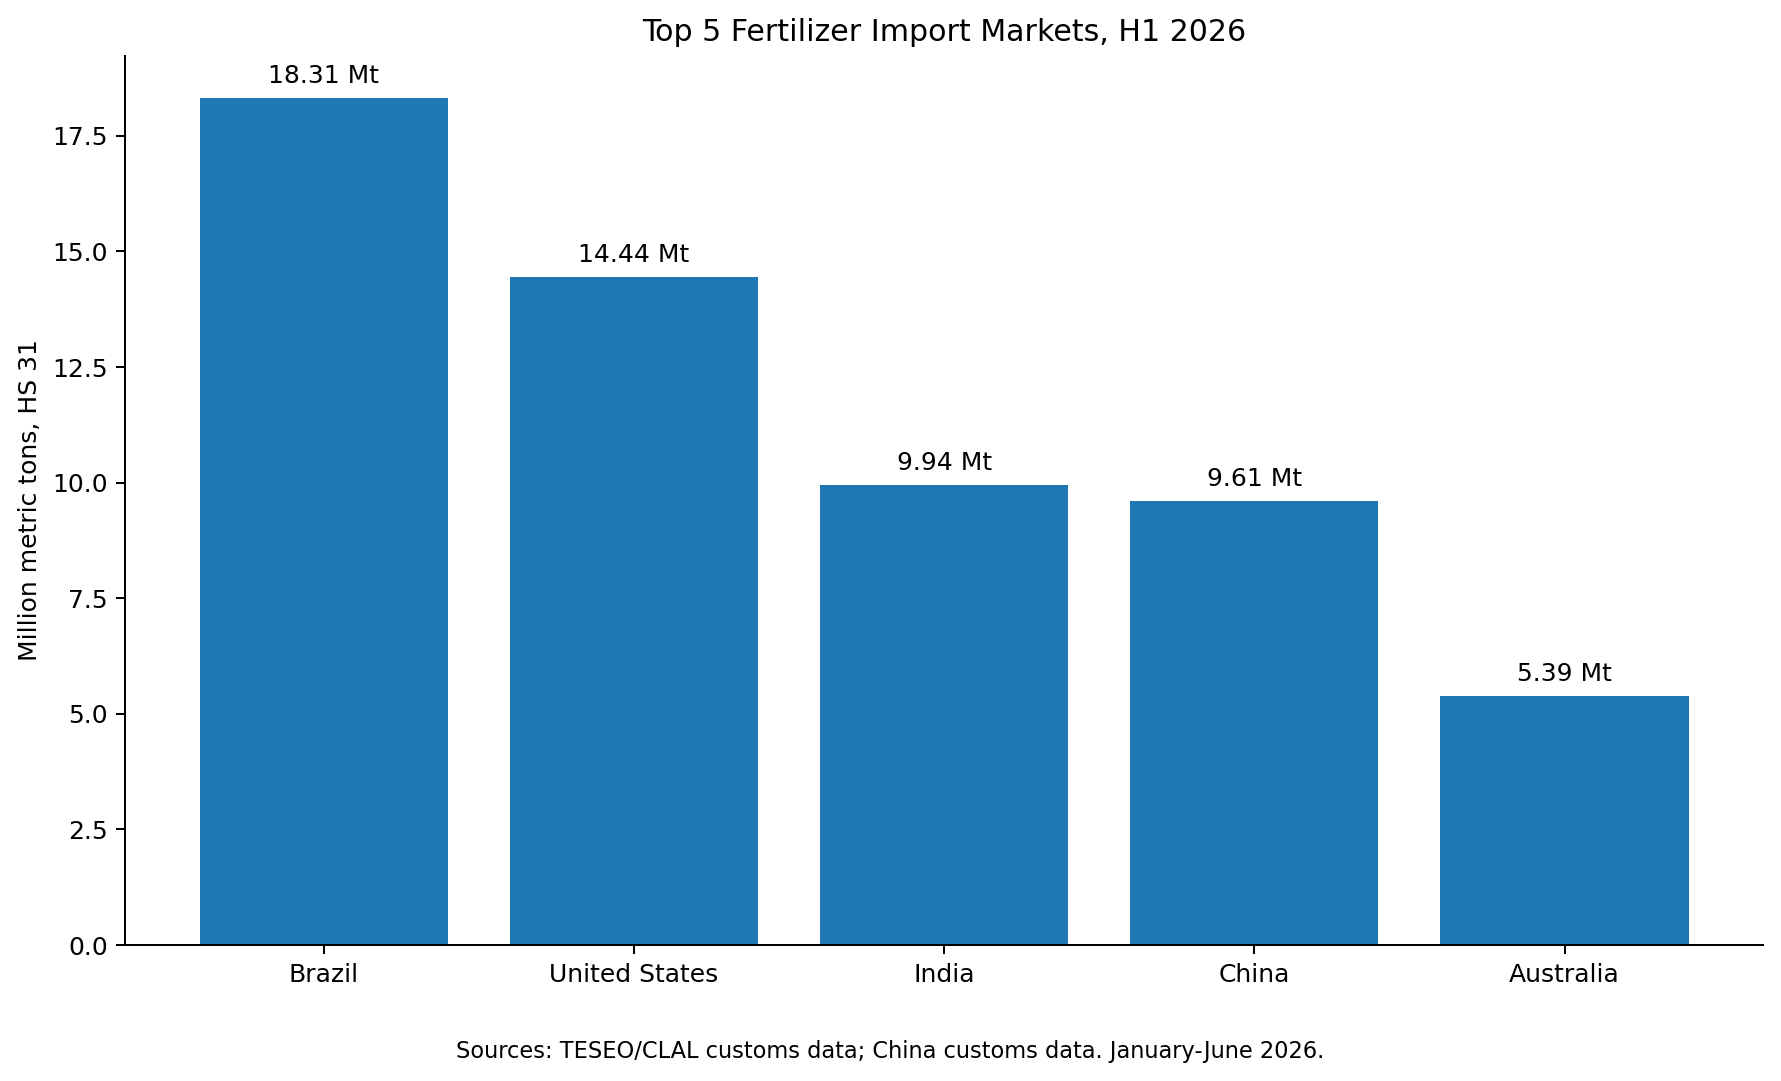
Methodology: the ranking starts with the five largest country-level fertilizer importers by trade value in 2025 according to World Bank WITS/UN Comtrade — Brazil, India, the United States, China and Australia — and reorders them by physical fertilizer import volume during January-June 2026. The European Union is excluded because it is a multi-country bloc. Fertilizers are measured under HS Chapter 31. H1 values for the United States, China and Australia are calculated from published January-July totals minus July shipments.
1. Brazil — 18.31 million tonnes
Brazil remained the largest fertilizer-import market in the ranking, bringing in approximately 18.31 million tonnes during the first six months of 2026.
That was about 5.7% lower than the 19.42 million tonnes imported during the same period of 2025. Higher international prices and tighter producer margins have encouraged Brazilian buyers to delay some purchases and adjust the nutrient mix.
Brazil’s structural import dependence remains exceptionally high. The country’s large soybean, corn, sugarcane and coffee sectors require volumes of nitrogen, phosphate and potash that domestic production cannot currently supply.
The composition of Brazilian nitrogen demand has also been changing. Fertilizer Daily reported earlier in 2026 that Brazilian ammonium sulfate imports had overtaken urea volumes as buyers responded to relative nutrient economics.
Phosphate supply has become another pressure point. Brazilian phosphate availability tightened in the second half of 2026 as sulfur costs increased and some domestic production was disrupted.
Brazil’s ranking therefore reflects both the scale of its agricultural sector and one of the highest levels of fertilizer import dependence among major crop-producing economies.
2. United States — 14.44 million tonnes
The United States ranked second with approximately 14.44 million tonnes of fertilizer imports in the first half of 2026, down roughly 2.7% from a year earlier.
Potash accounts for a particularly large share of inbound volume. The United States remains heavily dependent on Canadian potash, while nitrogen products such as urea and ammonia are sourced from a much broader group of suppliers.
Trade disruptions in the Persian Gulf exposed another vulnerability in the U.S. supply chain. Fertilizer Daily reported that U.S. fertilizer shipments from Hormuz-affected ports fell sharply in May, particularly affecting nitrogen and phosphate supply.
Despite substantial domestic ammonia, nitrogen and phosphate production, the scale of U.S. crop agriculture means imports remain essential for balancing regional nutrient demand.
The import mix may also change over the longer term as the United States evaluates new domestic potash and nitrogen projects and seeks alternative supply routes.
3. India — 9.94 million tonnes
India recorded the strongest absolute increase among the largest buyers, with fertilizer imports rising to approximately 9.94 million tonnes in January-June 2026 from 7.54 million tonnes a year earlier.
That represents growth of almost 32%.
The increase was driven mainly by nitrogen fertilizer demand. India’s domestic fertilizer system is large, but the country continues to rely heavily on imported urea, DAP, MOP and raw materials to maintain subsidized supplies for farmers.
The Persian Gulf disruption increased this reliance during 2026. IFPRI data show that India’s nitrogen fertilizer imports rose by more than 1.1 million tonnes during the first half of the year as reduced Gulf supply and constraints on domestic gas availability reshaped procurement.
India has responded with large international tenders and long-term supply arrangements. Fertilizer Daily reported in September that Indian state buyers had secured millions of tonnes of imported urea while landed costs fell sharply from their May peak.
India’s import growth is particularly important for the global urea market because large tenders can redirect cargoes across several exporting regions at once.
4. China — 9.61 million tonnes
China ranked fourth by estimated first-half import volume at approximately 9.61 million tonnes, up about 39% from the comparable 2025 period.
The increase may appear surprising because China is also one of the world’s largest fertilizer producers and exporters. The explanation lies largely in product composition.
China imports large quantities of potash because domestic potassium resources are insufficient to cover the requirements of its agricultural sector. Potassium chloride dominates fertilizer imports, while China simultaneously exports significant volumes of nitrogen fertilizers and other products.
Preliminary China Customs data show the trend continued after June: fertilizer imports reached 11.02 million tonnes in January-July 2026, up 44.7% year on year.
At the same time, export policy has been unusually important for international markets. China restricted exports of several phosphate fertilizer products during 2026, while changes in urea export availability repeatedly affected international pricing.
China therefore occupies an unusual position in the ranking: it is simultaneously a major importer of potash and a major potential exporter of nitrogen and phosphate fertilizers.
5. Australia — 5.39 million tonnes
Australia imported approximately 5.39 million tonnes of fertilizers in the first half of 2026, around 10% more than during the same period of 2025.
Nitrogen fertilizer dominates the country’s import requirements, particularly urea used across grain and broadacre cropping regions.
Australia was among the import markets most exposed to disruption in Persian Gulf shipping. The country normally sources a large proportion of agricultural urea through supply chains linked to the Gulf, forcing the government and private importers to secure alternative cargoes during the 2026 disruption.
Indonesia became an important alternative supplier. A first 47,250-tonne Indonesian urea cargo arrived in Australia in June under a broader government-supported supply agreement.
The episode illustrates why import volume alone does not fully measure fertilizer-market risk. Australia imports less fertilizer than Brazil or the United States, but its dependence on overseas nitrogen supply and long shipping routes can make supply disruptions disproportionately important.
India and China are changing the 2026 ranking fastest
The biggest shift in the first-half data is not at the top of the table but in Asia.
India increased fertilizer imports by approximately 2.40 million tonnes year on year, while China added roughly 2.68 million tonnes. Combined, the two countries imported more than 5 million additional tonnes compared with the first half of 2025.
By contrast, Brazil and the United States collectively reduced imports by around 1.5 million tonnes.
Across all five markets, imports increased from approximately 53.6 million tonnes in H1 2025 to 57.7 million tonnes in H1 2026, an increase of roughly 7.6%.
This divergence helps explain why global fertilizer markets can remain tight even when demand weakens in individual regions. Lower buying in Brazil or the United States can be offset by stronger procurement from India and China.
Why the rankings matter for fertilizer prices
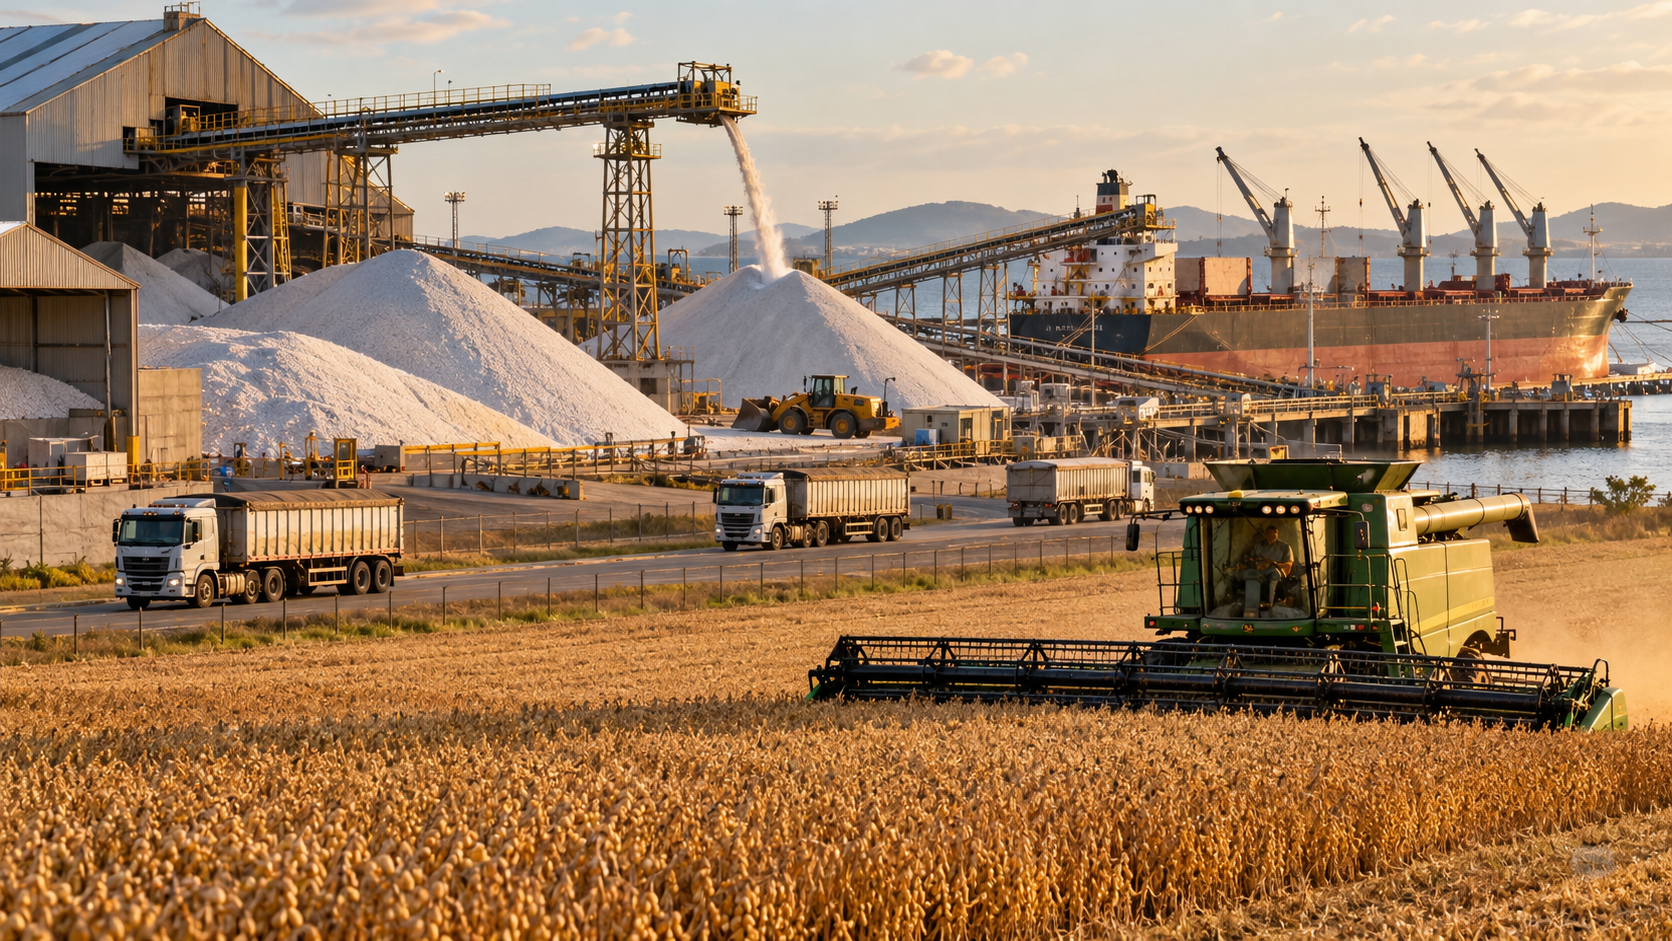
The five markets in this ranking influence international fertilizer prices far beyond their individual borders.
Large tenders from India can redirect urea cargoes from the Middle East, China, Russia or Southeast Asia. Brazilian purchases can determine the destination of granular urea and potash cargoes during the second half of the year. U.S. potash demand is closely linked to Canadian supply, while Australia competes with Asian markets for imported nitrogen.
China has an additional role because it operates on both sides of the trade balance. Changes in Chinese export policy can alter global supply at the same time as the country increases its own potash imports.
The result is an increasingly interconnected fertilizer market in which changes in one major importing country can quickly affect freight rates, tender prices and availability elsewhere.
2026 fertilizer trade is being reshaped by supply risk
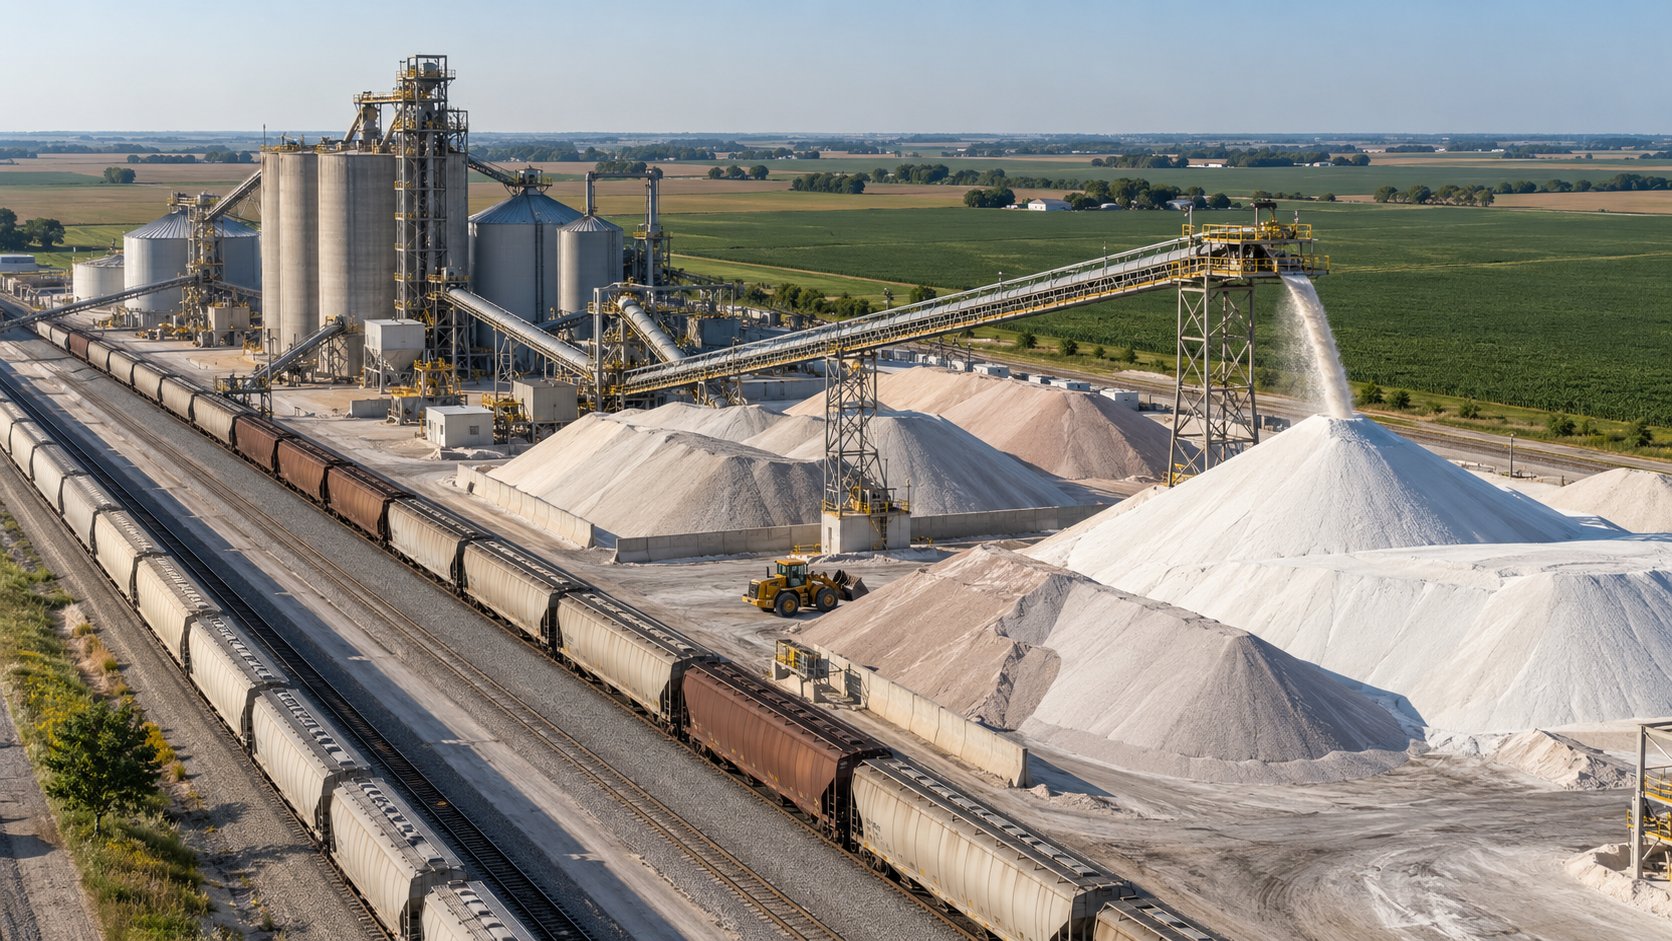
The first half of 2026 was unusually disruptive for global fertilizer trade.
The closure and subsequent disruption of shipping through the Strait of Hormuz affected nitrogen and raw-material flows from the Persian Gulf. IFPRI found that nitrogen fertilizer imports declined sharply in several markets during the first half of the year, while India increased purchases as domestic and regional supply became constrained.
The WTO has also highlighted the exposure of major agricultural importers to Gulf fertilizer supply, particularly India, Australia, Brazil and the United States.
At the same time, phosphate export controls, potash supply concentration and higher sulfur prices added pressure outside the nitrogen market.
These forces mean the final full-year 2026 ranking may differ from the first-half table. Brazil traditionally imports large fertilizer volumes later in the year, while procurement cycles in India, the United States and Australia are strongly seasonal.
What to watch through the end of 2026
- Brazil: whether delayed purchasing produces a stronger import wave ahead of the 2026/27 crop season.
- United States: fall application demand, potash sourcing and nitrogen import costs.
- India: additional urea tenders and the balance between domestic production and imports.
- China: potash import growth and policy governing urea and phosphate exports.
- Australia: diversification of urea supply away from Gulf-dependent routes.
Because the ranking is based on first-half data, it should be treated as a 2026 year-to-date snapshot rather than a final annual table. Fertilizer Daily will be able to update the ranking once complete 2026 customs data are available.
Frequently asked questions
Brazil ranked first among the five largest country-level fertilizer import markets in the first half of 2026, with approximately 18.31 million tonnes imported between January and June.
Among the five markets in the ranking, China recorded the fastest percentage growth, with first-half fertilizer imports increasing by approximately 39% year on year. India followed with growth of nearly 32%.
China is a major producer and exporter of nitrogen and phosphate fertilizers, but it relies heavily on imported potash. This creates substantial two-way fertilizer trade.
Brazil has one of the world’s largest agricultural sectors but insufficient domestic production of nitrogen, phosphate and especially potash to meet total crop demand. Imports therefore supply most of the country’s fertilizer requirements.
No. The ranking compares individual countries. The European Union is excluded because it is a 27-country trading bloc rather than a single country.
No. The ranking covers January through June 2026. Full-year positions may change because fertilizer imports are seasonal and several major buyers purchase a large share of annual requirements during the second half of the year.
Sources: World Bank WITS / UN Comtrade, TESEO — Brazil, TESEO — United States, TESEO — India, TESEO — Australia, China Customs trade data, IFPRI, WTO

Enjoyed this story?
Every Monday, our subscribers get their hands on a digest of the most trending agriculture news. You can join them too!




Discussion0 comments